What Is the Bowtie Method and How Does It Apply in Risk Management?
Introduction
In high-risk industries, structured risk management is a necessity. Bowtie Risk Analysis is a valuable tool for visualizing how hazards can lead to consequences and identifying the controls that prevent or mitigate them.
Named for its bow tie-shaped diagram, this method provides a clear link between causes and outcomes, making it easier to communicate risks and responsibilities across all levels of an organization. It bridges the gap between theory and practice, helping companies manage operational risks more effectively.
With increasing regulatory demands in sectors such as oil and gas, aviation, healthcare, and chemical processing, Bowtie offers a defensible and practical framework for demonstrating control over significant accident hazards.
Understanding the Bowtie Method
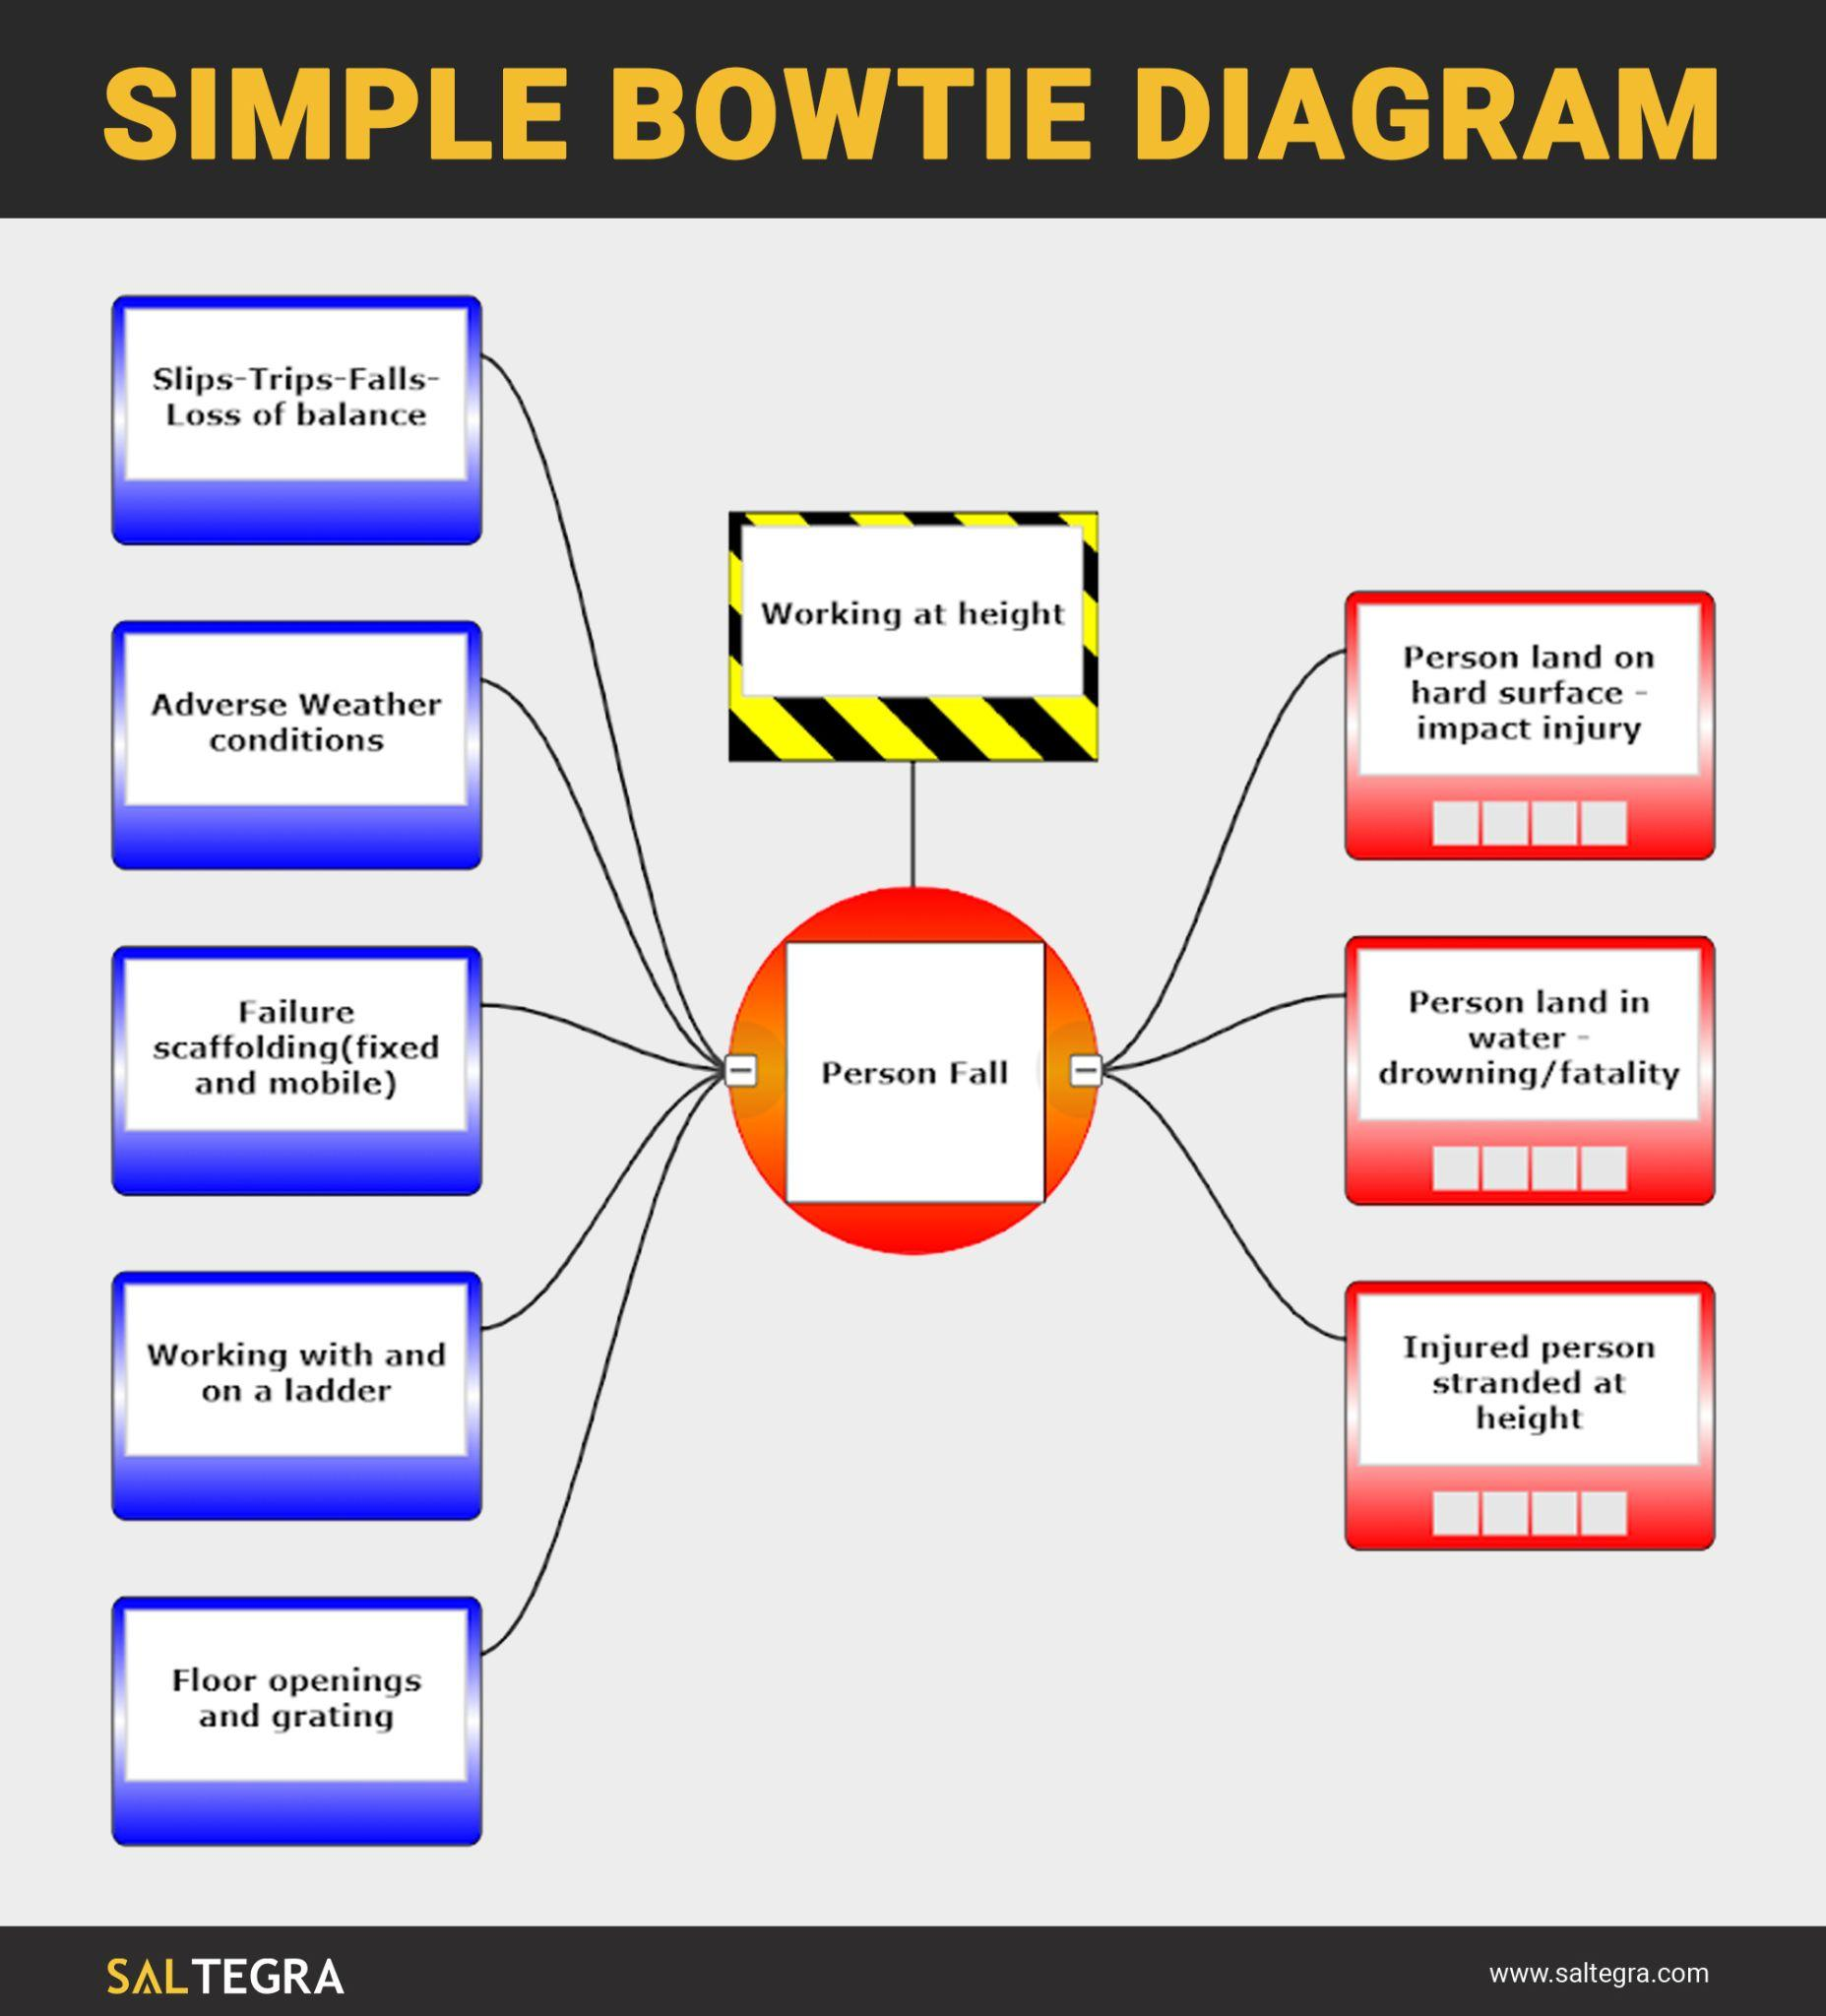
Bowtie Risk Analysis is a visual tool that maps how hazards can lead to critical events and what controls are in place to prevent or mitigate them. At the center of the diagram is the ‘top event,’ with threats leading into it on the left and consequences flowing from it on the right. Preventive controls block threats from reaching the top event, while mitigative controls limit the impact of consequences if the event occurs. These pathways can represent equipment failures, human errors, or process weaknesses.
What sets Bowtie apart is its ability to link specific threats and consequences to their respective controls, offering a transparent and practical framework for understanding and managing operational risks.
What Makes the Bowtie Risk Analysis Effective?
Proactive Risk Control
The Bowtie method fundamentally shifts organizational risk perspectives from reactive to proactive approaches. By clearly mapping preventive barriers before a top event occurs, organizations can systematically strengthen defenses against potential threats. This proactive orientation enables risk managers to allocate resources more effectively toward preventing incidents rather than merely responding to them. The method also supports barrier management by assessing the effectiveness, independence, and resilience of control measures.
Organizations implementing Bowtie Risk Analysis can systematically evaluate whether control measures are technical, procedural, or administrative and assess their relative strength in preventing threat progression or mitigating consequences.
Visual Clarity
Complex risk scenarios requiring extensive documentation to explain textually can be represented in a single, comprehensive diagram that is immediately understandable to diverse stakeholders. This visual representation creates a common language for discussing risks across organizational hierarchies.
The visual nature of Bowtie diagrams makes them particularly effective communication tools in safety briefings, management reviews, and regulatory discussions. Frontline workers can quickly grasp the threats they face and the control measures that protect them. At the same time, executives can understand the systematic approach to managing critical risks without requiring detailed technical explanations.
Identifies Weak Points
The structured format of Bowtie analysis forces rigorous examination of control measures, including potential degradation factors that could compromise their effectiveness. These “threats to barriers” highlight vulnerabilities in the risk control system that might remain undetected until a failure occurs.
Organizations can implement additional safeguards or strengthen existing controls before incidents occur by identifying common mode failures, single points of weakness, or barriers that lack diversity. This systematic identification of weak points enables targeted improvement initiatives and more efficient allocation of safety resources.
How To Perform Bowtie Analysis in Risk Management
Step 1: Establish a Top Event
The first step in Bowtie analysis is to define the top event, which marks the point where control over a hazard is lost, but no consequence has yet occurred. This transition from normal operation to a potential incident should focus on the loss of control (e.g., “Loss of containment”) rather than the outcome (e.g., “Explosion”).
The top event should be specific enough to guide the analysis while broad enough to cover all relevant threats and consequences. During workshops, it may take several iterations to refine this definition.
Step 2: Establish Preceding Events To Root Cause Threats
After defining the top event, the next step is identifying all credible threats that could lead to it. This process requires input from various disciplines such as operations, maintenance, safety, and subject matter experts to ensure a thorough assessment.
Each threat should be traced back to its root cause. For example, instead of noting “equipment failure,” specify causes like “seal degradation due to chemical incompatibility” or “pressure relief valve failure from lack of maintenance.” Tools such as HAZOP, FMEA, and incident investigation reports can help build a complete and accurate threat inventory.
Step 3: Establish Consequences Following Top Event
If the top event occurs, it can lead to a range of consequences depending on the circumstances and the effectiveness of mitigation measures. This step involves identifying all potential outcomes, including impacts on safety, the environment, operations, finances, and reputation. Consequences should be as specific and measurable as possible.
The analysis should also consider how initial outcomes may escalate, such as a small fire triggering an explosion if containment fails, potentially resulting in severe harm or fatalities if evacuation procedures break down.
Step 4: Establish All Impacts
For each consequence, the analysis should identify the broader impacts on organizational goals, stakeholders, and society. This step connects technical findings to business priorities, helping leaders make informed decisions.
Where possible, impacts should be quantified, including financial losses, regulatory penalties, legal liabilities, and downtime. This makes the case for proactive investment in controls. The assessment should also account for intangible effects such as damage to stakeholder trust, community relations, and company culture.
Step 5: Insert Risk Controls
The final step is to map all preventive and mitigative controls across the Bowtie diagram. These controls serve as barriers to either prevent the top event or reduce its consequences. Each control should be clearly defined by its type, effectiveness, independence, auditability, and resilience, with assigned ownership and verification mechanisms.
This step often highlights gaps in the existing risk management system and identifies areas where additional controls are needed. It also helps assess vulnerabilities where a single failure could compromise multiple barriers.
Possible Pitfalls When Using Bowtie and How To Avoid Them
- Risk Management Isolation – Bowties performed outside established risk management programs result in findings being omitted from core processes, creating dangerous oversight gaps. Mitigate by formally integrating Bowtie protocols within the existing risk management framework with defined input/output relationships.
- Hazard Focus Imbalance – Excessive concentration on top events neglects secondary scenarios with substantial business impacts. Implement multi-event Bowtie methodology to capture the full spectrum of credible scenarios.
- Implausible Threat Inclusion – Adding conceivable but industry-improbable threats creates unnecessary complexity and dilutes analysis effectiveness. Implement strict validation criteria: if no participant has witnessed or documented the threat occurrence, exclude it from analysis.
- Control Categorization Errors – Excessive granularity in control definition creates unwieldy, uninterpretable diagrams. Consolidate protection functions into logical functional groups with clear boundaries to maintain analytical clarity.
- Methodological Inconsistency – Varying approaches between facilitators prevent organizational comparability. Establish standardized assessment protocols through formal documentation before commencing any Bowtie program.
- Current/Future Control Confusion – Misrepresenting planned controls as existing protections creates dangerous false security. Implement mandatory visual differentiation through distinct color coding or patterns for future controls, and generate baseline diagrams showing only currently implemented controls.
- Organizational Bias – Insular perspective overlooks critical industry learnings. Require external event inclusion by appointing an independent moderator with cross-industry experience.
Organizations seeking to maximize benefits from Bowtie Risk Analysis increasingly turn to specialized training, such as BowTie XP Training USA, to develop internal capabilities. Bowtie Facilitation and Training in California, USA, has become particularly popular as organizations recognize the value of expert-led implementation.
Frequently Asked Questions
What Is the Bowtie Analysis ISO 31000?
The Bowtie methodology aligns seamlessly with ISO 31000 risk management standards by providing a structured approach to risk identification, analysis, and treatment. While ISO 31000 establishes principles and guidelines for effective risk management, the Bowtie method offers a specific implementation tool that satisfies the standard’s requirements for comprehensive risk assessment and communication.
What Is the Objective of the Bowtie Analysis?
The primary objective of Bowtie analysis is to provide a systematic, visual representation of risk scenarios that enables organizations to identify, understand, and manage critical controls preventing unwanted events and mitigating potential consequences. This methodology bridges the gap between risk identification and operational implementation by clearly visualizing control measures.
What Is the Difference Between Bowtie and FMEA?
While both FMEA and Bowtie analysis support effective risk management, they serve distinct purposes. FMEA focuses on specific component failures and their impact on system performance, operating at a detailed technical level. Bowtie, on the other hand, offers a broader view by mapping how various threats can lead to a central risk event and what controls are in place to prevent or mitigate its consequences. These methods are often used together, with FMEA results informing threat identification in Bowtie diagrams.
Conclusion
Bowtie Risk Analysis offers a structured and visual approach to managing complex operational risks by clearly mapping how threats can lead to consequences and where controls can intervene. This enhances risk understanding, communication, and barrier management across teams.
As regulatory expectations grow and the demand for effective risk oversight increases, more organizations turn to Bowtie as a best practice. Those seeking to strengthen their capabilities should consider partnering with experts like Saltegra Consulting for specialized training in Bowtie methodologies, such as BowTie XP USA programs, to build in-house expertise.
By investing in robust Bowtie implementation, organizations not only improve risk control but also demonstrate a strong commitment to operational excellence and stakeholder safety.


